Identification of gut microbiome features associated with host metabolic health in a large population-based cohort

Study population and design
A total of 8859 participants from the HPP24 who were measured with CGM, DXA scan, liver US and gut microbiome metagenomic sequencing were analyzed—4778 (53.9%) women and 4081 (46.1%) men, with an average age of 51.8 (7.8) years and average BMI of 26.0 (4.1) (kg/m2). Thirty-eight metabolic health measures were defined as the outcomes of interest (see “Metabolic health measures” in Methods). Table 1 summarizes the main characteristics of the participants, with select CGM-derived measures (see Table S1 for the complete characteristics with all CGM measures, and “Study population” in Methods for the complete description of the HPP).
Gut microbiome metagenomic sequencing data was functionally profiled with HUMAnN25 and MetaPhlAn26 to obtain bacterial gene families and pathways abundances (see “Microbiome sample collection and processing” and “Metagenomic reads mapping and functional profiling” in Methods). The 38 metabolic measures of interest were divided into 10 categories: Body composition including BMI and measures from DXA scan, Liver US, and 8 categories of CGM-derived measures (see “Metabolic health measures” in Methods).
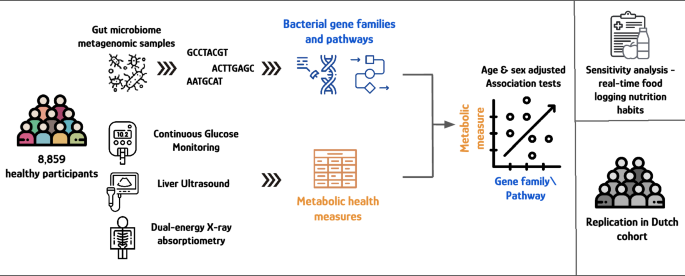
Associations between each bacterial gene family and bacterial pathway, with each metabolic health measure were assessed using linear regression models, adjusted for age and sex, in a similar way to genome-wide association studies (GWAS). Associations were considered significant if found to have a Bonferroni-corrected p-value < 0.05 (see “Bacterial gene families/pathways—metabolic measures associations” in Methods). Overview of the study design is illustrated in Fig. 1.

Illustration of the study design.
Bacterial gene families and pathways associate with metabolic health measures
Overall, 565,398 unique bacterial gene families and 346 unique bacterial pathways were associated with 38 metabolic health measures. We found 87,678 (15.5%) unique bacterial gene families significantly associated with metabolic health measures in 284,759 different correlations, and 145 (41.9%) unique bacterial pathways significantly associated with metabolic health measures in 862 different correlations. Most significant associations were negative—both for the bacterial gene families (239,077 (83.96%)) and the bacterial pathways (621 (72.0%)). From the 145 bacterial pathways that were significantly associated with at least one metabolic health measure, most pathways (126 (86.9%)) were significantly associated with two or more metabolic health measures. Similarly from the 87,678 bacterial gene families, the majority of the bacterial gene families (64,199 (73.22%)) were associated with two or more metabolic health measures.
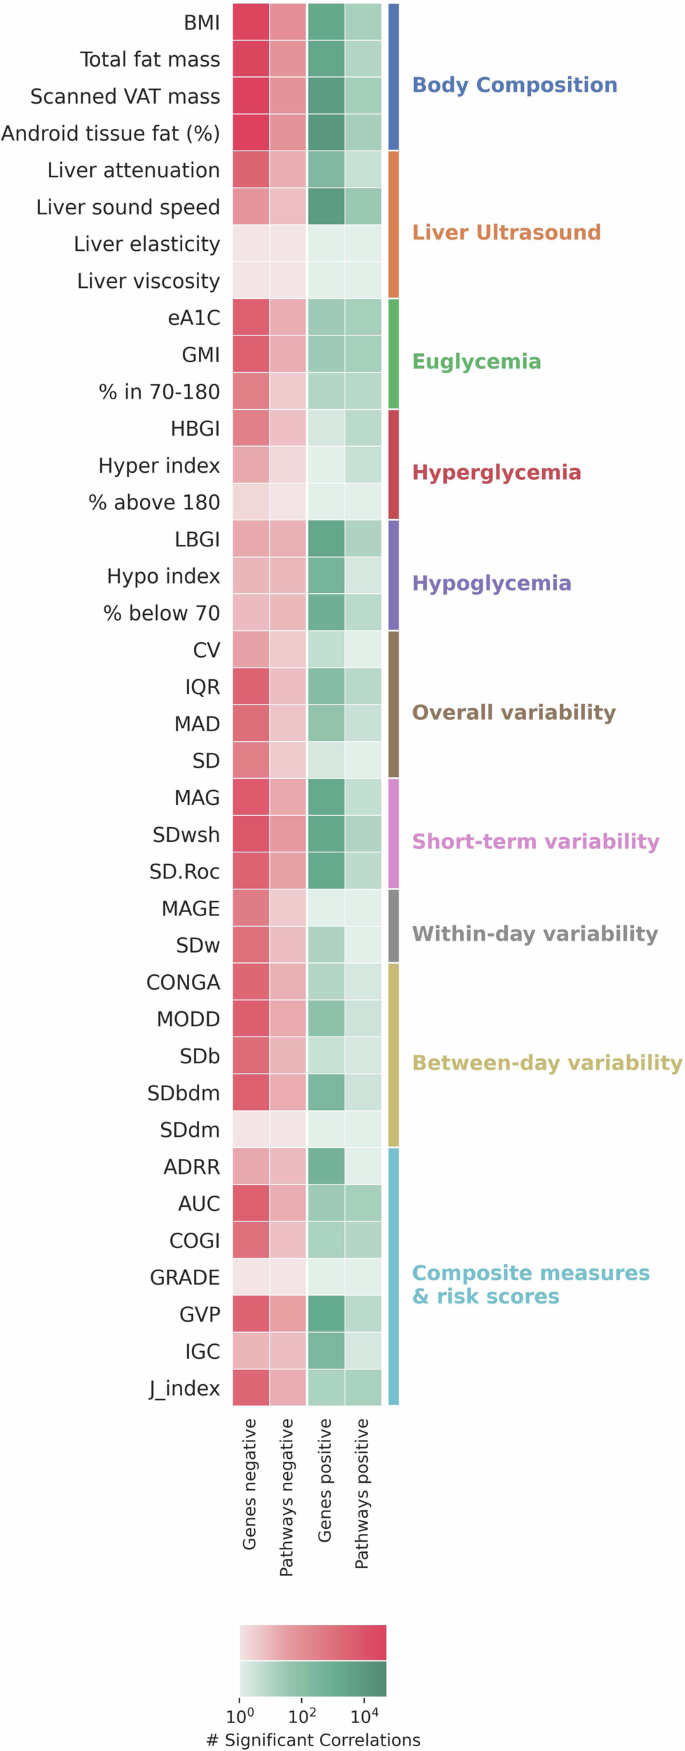
The body composition category showed the highest numbers of significant associations, both to bacterial gene families and bacterial pathways (Fig. 2). 21,871 unique bacterial gene families and 14 unique bacterial pathways were significantly correlated with at least one metabolic health measure from this category, and showed no significant associations with any measures from other categories. Most bacterial gene families and pathways were correlated with more than one measure in this category, yet some unique associations were found. Android fat tissue (%), the measure with the highest number of bacterial gene families associations, had 12,093 bacterial gene families uniquely associated solely with it and no other metabolic health measure that was tested. BMI had the highest number of bacterial pathways associated with it, and 10 bacterial pathways were uniquely correlated solely with it. All measures in this category showed a similar pattern, with the majority of association, both for bacterial gene families and bacterial pathways, being negative associations.

Heatmap showing the number of positive and negative significant associations between each metabolic health measure and bacterial gene families and pathways. Associations were obtained using two-sided linear regression adjusted for age and sex, and corrected for multiple comparisons using the Bonferroni method. Associations with Bonferroni-corrected p-value < 0.05 were considered significant. Colored bar on the right shows the category assigned for each metabolic health measure.
Diverse association patterns were observed across other categories. Liver viscosity and liver elasticity10 showed no significant associations with any bacterial gene family or pathway. Liver sound speed demonstrated predominantly positive significant associations with both bacterial gene families and bacterial pathways. In contrast, liver attenuation, which describes the reduction in ultrasound beam intensity as it traverses the liver and has been linked to clinical liver state indicators27, exhibited almost only negative significant associations with bacterial gene families and bacterial pathways.
CGM-derived measures showed variable association patterns. Measures of short-term variability; SD within series (SDwsh)28, Standard Deviation of the Rate of Change (SD.Roc)29 and Mean Absolute Glucose (MAG)30, were associated with a high number of bacterial gene families and pathways compared to other categories of CGM-derived measures (Fig. 2). Similar to body composition most associations with these short-term variability measures were negative. Measures of hyperglycemia—% above 180, HBGI31 and Hyper index32—showed the lowest numbers of significant associations with bacterial gene families and pathways. eA1C33 and GMI34, both transformations of the mean-glucose measured from CGM, showed similar association patterns, and were found to be significantly associated with 3396 bacterial gene families and 14 pathways.
Short-term variability, between-day variability, and within-day variability measures from CGM showed similar association patterns within their category, in terms of the number of significant associations and the correlation direction. Overall variability measures showed a differing pattern where, for example, the IQR (interquartile range) was significantly associated with 2967 bacterial gene families and 6 pathways, while the CV (coefficient of variation) was only significantly associated with 25 bacterial gene families and 3 pathways (Fig. 2).
Despite most associations across body composition, Liver US and CGM-derived measures in the different categories being negative, for measures of hypoglycemia—% below 70, LBGI31 and Hypo index32—most associations to bacterial gene families were positive, as well as for ADRR35 and IGC32 (Fig. 2). The Average Daily Risk Range (ADRR) is calculated to quantify the daily glucose variability and risk, integrating both hypoglycemic and hyperglycemic excursions into a single metric that reflects overall glycemic risk. It is derived by averaging the daily risk scores, which assess the likelihood and severity of glucose deviations from the normal range. The Index of Glycemic Control (IGC) provides a composite measure that combines average glucose levels, variability, and episodes of hyper- and hypoglycemia, giving a holistic view of glucose control efficacy and stability.
To address high correlations between bacterial gene families, and identify independent bacterial gene families associated with the examined metabolic health measures, two approaches were implemented. Upfront gene filtering was employed prior to the association analysis to obtain uncorrelated representative gene families (see “Upfront gene filtering” in Methods), resulting in 55,925 pre-filtered bacterial gene families that were then associated with metabolic health measures. Clumping, commonly used in GWAS analyses (see “Gene clumping” in Methods), was employed post association analysis, to each metabolic health measure individually, to obtain a subset of independent associations. Both approaches resulted in similar numbers of significant uncorrelated bacterial gene families associated with metabolic health measures (Figs. S1 and S2). In both, Android fat tissue (%) was the measure with the highest number of independent bacterial gene families associations (1342 from clumping, 2217 from pre-filtering), followed by Scanned visceral adipose tissue (VAT) mass (1317 from clumping, 2013 from pre-filtering) (Figs. S1 and S2). While measures of short-term CGM variability, had hundreds or tens of independent associations with bacterial gene families, for example SD.wsh (148 from clumping, 140 from pre-filtering) and SD.Roc (87 from clumping, 78 from pre-filtering), measures of overall variability, within-day variability, and between-day variability were found to have only several to tens of independent associations. The IQR and MAD were associated with 2967 and 1231 bacterial gene families accordingly. Clumping identified only 14 and 11 independent clumps of bacterial gene families (Fig. S1), and pre-filtering identified 45 and 18 uncorrelated bacterial gene families (Fig. S2).
“Key” associated bacterial gene families and pathways
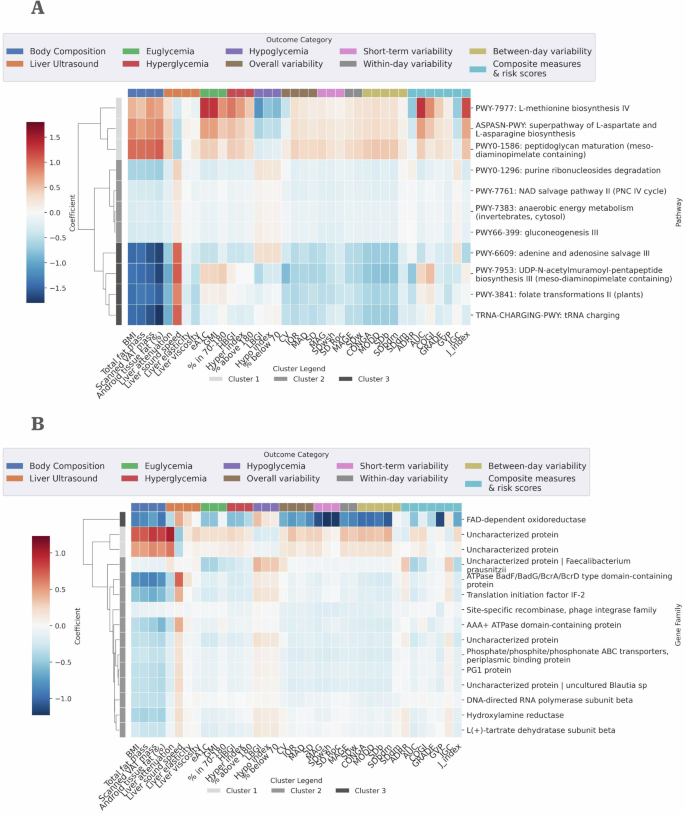
Aiming to narrow our focus and pinpoint crucial bacterial gene families and pathways, we devised a methodology to select “key” bacterial gene families and pathways—prioritizing entities based on their significance across multiple metabolic health measures and the robustness of their associations, defined by their Bonferroni-corrected p-values (see “Selecting “key” associated bacterial gene families and pathways” in Methods). 5 bacterial pathways and 5 independent bacterial gene families were selected as “key” entities, for each group of metabolic health measures: Body composition, Liver US and all CGM-derived measures. This process results in 11 unique bacterial pathways and 15 unique bacterial gene families that were chosen as “key” entities. Figure 3 displays a heatmap of the correlations of these “key” entities with the metabolic health measures. Tables S2 and S3 show for each “key” bacterial pathway and gene family the metabolic health groups it was chosen for.

Heatmaps showing the correlation coefficient of the A 11 “key” bacterial pathways and B 15 “key” clumped bacterial gene families with the highest number of significantly associated metabolic health measures and lowest p-value ranking across groups (see “Selecting “key” associated bacterial gene families and pathways” in Methods). Associations were performed using two-sided linear regression adjusted for age and sex. Multiple comparisons were corrected using the Bonferroni method, and associations with Bonferroni-corrected p-value < 0.05 were considered significant.
The 11 “key” pathways clustered to 3 groups, with distinct correlation patterns to the tested metabolic health measures (Fig. 3A, Table S2). Cluster I, showing strong positive correlations to most metabolic health measures, with negative correlations to hypoglycemia measures derived from CGM, included 2 pathways with roles in the biosynthesis of amino acids; superpathway of L-aspartate and L-asparagine biosynthesis (ASPASN-PWY) and L-methionine biosynthesis IV (PWY-7977). High ratio of asparagine to aspartate was shown to be associated with an increased risk for T2D36, and aspartate was significantly associated with decreased insulin secretion, elevation of fasting glucose levels and increased risk of T2D37. Methionine metabolism have been previously linked to metabolic syndrome and related diseases, and elevated serum S-adenosylmethionine (SAM) was found in individuals with NAFLD38. In addition, Methionine levels have been found to significantly associate with Matsuda insulin sensitivity index in a long-term follow-up study of ~5000 Finnish men37. The third pathway in this cluster was PWY0-1586, responsible for peptidoglycan maturation.
Pathways in cluster II and III showed an opposite correlation pattern to Cluster I with negative correlations with body composition and most CGM-derived, Liver US measures, and positive correlations with hypoglycemia measures. Cluster III showed stronger correlation, with higher correlation coefficients compared to Cluster II. Cluster II includes NAD salvage pathway II (PNC IV cycle) (PWY-7761) and purine ribonucleosides degradation (PWY0-1296). NAD+ metabolism plays a key role in insulin sensitivity and is, at times, disrupted by obesity and age39,40. Elevating NAD+ levels, using nicotinamide mononucleotide (NMN), a key NAD+ intermediate, was shown to correct metabolic disturbances and ameliorate glucose intolerance and insulin resistance in T2D mice41. Purine dysregulation has been tied to several metabolic diseases, including gout and metabolic syndrome42, which are often accompanied by insulin resistance. The purine degradation pathway was shown to be enriched in the gut microbiome of individuals with obesity in a study of a small Korean population43. The two additional pathways in this cluster—gluconeogenesis III and anaerobic energy metabolism (invertebrates, cytosol)—have known, critical roles in energy and glucose metabolism, yet to the best of our knowledge, no current evidence connect them directly to any of the examined host metabolic health measures.
Cluster III, with the same correlation pattern as Cluster II yet with stronger associations, included PWY-6609: adenine and adenosine salvage III. This pathway is part of the purine salvage pathway, which recycles adenine and adenosine. The adenosine system has been highlighted for its critical role in regulation of insulin and glucose homeostasis in individuals with T2D, and its receptor system was associated with development or progression of diabetes mellitus, with specific focus on T2D44. Another pathway in this cluster is PWY-3841: folate transformations II. Folate depletion has been previously reported to potentially cause oxidative stress in the liver, leading to the development of NAFLD45. Folate deficiency has also been tied to obesity, and lower levels of folate have been observed in individuals with obesity46. The two remaining pathways in Cluster III are TRNA-CHARGING-PWY: tRNA Charging, a pathway essential for protein synthesis, enabling the attachment of amino acids to their corresponding tRNA molecules, and PWY-7953: UDP-N-acetylmuramoyl-pentapeptide biosynthesis III, a pathway involved in the synthesis of bacterial cell wall peptidoglycan, which is crucial for bacterial growth and survival.
“Key” clumped bacterial gene families showed two correlation patterns, similar to those observed in the “key” bacterial pathways (Fig. 3B). “Key” bacterial gene families were annotated using the UniRef database47. Cluster I, showing mostly positive correlations with metabolic health measures, included 2 bacterial gene families, chosen by their associations with the metabolic health measures in the Liver US group (Table S3), both uncharacterized proteins. Cluster III, containing a single bacterial gene family—FAD-dependent oxidoreductase, showed an opposite correlation pattern to Cluster I, with this bacterial gene family associating negatively with almost all metabolic health measures. Cluster II of the “key” bacterial gene families includes several protein families involved in energy metabolism, such as ATPase BadF/BadG/BcrA/BcrD Type Domain-Containing protein, AAA+ ATPase domain-containing protein and Phosphate/phosphite/phosphonate ABC transporters and periplasmic binding protein. “Key” pre-filtered bacterial gene families showed slightly stronger associations to metabolic health measures than those of the “key” clumped gene families (Figs. 3B and S3), with a single correlation pattern of mostly negative correlations and positive correlations only to hypoglycemia measures derived from CGM (Fig. S3). Cluster II encompasses a broad spectrum of gene families (Table S4), including those with recognized enzymatic roles in metabolism such as Pyridoxamine 5’-phosphate oxidase family protein48 and Aminotransferase, which previous research highlighted as potentially involved in the pathogenesis of metabolic syndrome49. Several of the “key” bacterial gene families in the clumping analysis and pre-filtering analysis were uncharacterized proteins sourced from the species Faecalibacterium prausnitzii (Figs. 3B and S3); one of the most abundant bacterial species in the colon of healthy humans. Changes in Faecalibacterium prausnitzii abundances were related to various intestinal and metabolic diseases50.
Community-level contributions to bacterial pathways
The “key” bacterial pathways identified in the previous analysis represent specific functionalities associated with metabolic health measures. These functionalities could result from two different biological scenarios: (1) a community-level functionality where multiple microbial species or genera contribute to an overall functional capacity, or (2) a scenario where a single microbial species or genus predominantly encodes the functionality. To distinguish between these possibilities, we utilized the HUMAnN generated abundance contributions from specific organisms25 to the abundance of bacterial pathways. For each bacterial pathway, we identified the contributing genera and species (see “Metagenomic reads mapping and functional profiling” in Methods) and examined the distribution of their contributions in terms of RPKs.
Of the 346 bacterial pathways associated with metabolic health measures, 74 (21.4%) were attributed to unclassified bacteria, while the majority, 272 (78.6%), were linked to known bacterial species and genera. The number of contributing genera and species varied across bacterial pathways (Fig. S4), with an average of 13.02 (±20.03) species and 7.4 (±10.05) genera contributing to the abundance of each bacterial pathway. Notably, most pathways (231 (66.8%)) had their abundances contributed by multiple species.
The “key” bacterial pathways in Cluster I exhibited a diverse contribution from multiple genera, with 10–24 genera, and 22–53 species contributing to each bacterial pathway’s abundance (Figs. S5 and S6). This suggests a community-level functionality where several genera and species are collectively responsible for the metabolic functions associated with these pathways. Similarly, the pathways in Cluster III also showed contributions from a wide range of genera and species, with 16–33 genera and 40–65 species contributing to each pathway’s abundance (Figs. S9 and S10). This pattern further supports the concept of community-level functionality for these “key” bacterial pathways. In contrast, the “key” bacterial pathways in Cluster II were predominantly associated with unclassified bacteria (Figs. S7 and S8), meaning we currently lack sufficient taxonomic resolution to attribute these functions to specific known genera or species. As a result, it remains unclear whether these pathways are driven by a single microbial taxon or reflect a broader community-level functionality. Only one pathway in this cluster, PWY0-1296, had contributions from 19 recognized genera and 23 recognized species (Figs. S7 and S8).
The variable distributions of the number of contributing genera and species, and the diversity of genera and species contributing to the “key” pathways suggests that these likely represent community-level functionalities associated with metabolic health measures. In addition, the presence of unclassified contributions for some pathways highlights the importance of analyzing gut microbiome data at the functional level, as there are still under-characterized taxonomic groups that could lead to a loss of valuable information.
Sensitivity analysis—nutritional habits from real-time food intake logging
Nutritional habits potentially affect host metabolic health measures such as body composition, glucose control, as measured by CGM51, and gut microbiome composition and function52. To address this, we integrated information from real-time food intake logging, reported by participants during their CGM connection, and repeated all association analyses adjusting for 5 additional nutritional summaries; Healthy Food Diversity (HFD) Index53, median total caloric intake, and median amount of calories (as percentage) consumed from carbohydrates, proteins and lipids (see “Nutritional summaries as sensitivity analysis” in Methods). 862 significant bacterial pathway associations and 284,759 significant bacterial gene families associations with metabolic health measures were discovered in our main analysis. Of these, 539 (62.53%) bacterial pathway associations and 193,927 (68.1%) bacterial gene families associations replicated when adjusting for nutritional summaries. All replicated associations replicated with the same correlation direction.
Android tissue fat (%) retained the highest number of associations with bacterial gene families, with 53,186 significant associations replicating 80.2% of the significant associations found in the main analysis. BMI retained the highest number of associations with bacterial pathways, with 99 significant associations replicating 98.1% of the significant associations found in the main analysis. Body composition metabolic health measures in general largely preserved their significant correlations, as well as liver attenuation and liver sound speed from liver US, as illustrated in Fig. S11. Euglycemia measures derived from CGM also showed similar correlations after adjusting for nutritional summaries. The noticeable decrease in significant associations for overall, short-term, and within-day variability measures after adjusting for nutritional summaries aligns with prior findings that highlighted the correlations between nutritional summaries and CGM variability measures54 (Fig. 2, Fig. S11). MAGE, a within-day glucose variability measure known to be affected by nutritional habits, such as carbohydrate consumption55,56, had 352 bacterial gene families and 3 pathways associated with it prior to the adjustment to nutritional habits. Following the adjustment, no significant associations were found. MODD on the other hand, a day to day variability measure57, had 4438 and 19 significant associations with bacterial gene families and pathways in the main analysis, and 436 (9.8%) bacterial gene families and 5 (26.3%) pathways associations remained significant when adjusting to nutritional summaries, suggesting these are indeed associations of the bacterial functional levels with MODD, not mediated nor confounded by diet.
Repeating the analysis of “key” pathways with the adjusted associations for nutritional summaries, we observed that 7 of the 11 “key” pathways remained unchanged, and showed similar correlation patterns to the main analysis (Fig. 3A, Fig. S12). The 13 “key” pathways after adjusting to nutritional summaries, were also clustered to 3 groups, with similar correlation patterns as the 11 “key” pathways in the main analysis (Tables S2 and S5). Six additional “key” bacterial pathways were introduced in the sensitivity analysis. PWY-6122: 5-aminoimidazole ribonucleotide biosynthesis II, PWY-6277: superpathway of 5-aminoimidazole ribonucleotide biosynthesis and PYRIDNUCSYN-PWY: NAD de novo biosynthesis I (from aspartate), in cluster I, showing mostly positive correlations to metabolic health measures. Bacterial pathway PWY-6122 was previously found to be enriched in individuals with hyperuricemia (HUA) and high levels of liver enzymes58. HUA, characterized by elevated uric acid levels in the blood, is linked to both insulin resistance59 and diabetes60. In cluster II, two bacterial pathways revealed in the sensitivity analysis were ARGSYN-PWY: L-arginine biosynthesis I (via L-ornithine) and ARGSYNBSUN-PWY: L-arginine biosynthesis II (acetyl cycle), both related to the biosynthesis of arginine and showing mostly negative correlations to metabolic health measures. Previous works suggest that L-arginine may have potential to prevent and/or relieve type 2 diabetes via restoring insulin sensitivity in vivo61. The last “key” pathway revealed in the sensitivity analysis was in cluster III, PEPTIDOGLYCANSYN-PWY: peptidoglycan biosynthesis I (meso-diaminopimelate containing), showing mostly negative correlations to metabolic health measures.
Associations with BMI replicate in an independent cohort
Utilizing a cohort of 8205 Dutch individuals, with gut microbiome metagenomic samples and information on age, sex, and BMI62 we sought to assess the replicability of our results in an independent cohort. 8205 individuals, of them 3451 (42.1%) men and 4754 (57.9%) women were analyzed, with an average age of 48.4 (14.8) years and an average BMI of 25.6 (4.4) (kg/m2) (Table S6). Metagenomic samples were processed in the same manner as in the discovery cohort, and association models were run only against BMI as the only metabolic health measure available in the replication cohort (see “Replication in independent cohort” in Methods).
128 pathways and 66,697 bacterial gene families were significantly correlated with BMI in the discovery cohort. 83 (64.84%) pathways were also significantly correlated with BMI in the replication cohort, where 78 (93.9%) replicated with the same correlation direction. 33,302 (49.9%) bacterial gene families were significantly replicated in the replication cohort, where 33,294 (99.9%) replicated with the same correlation direction.
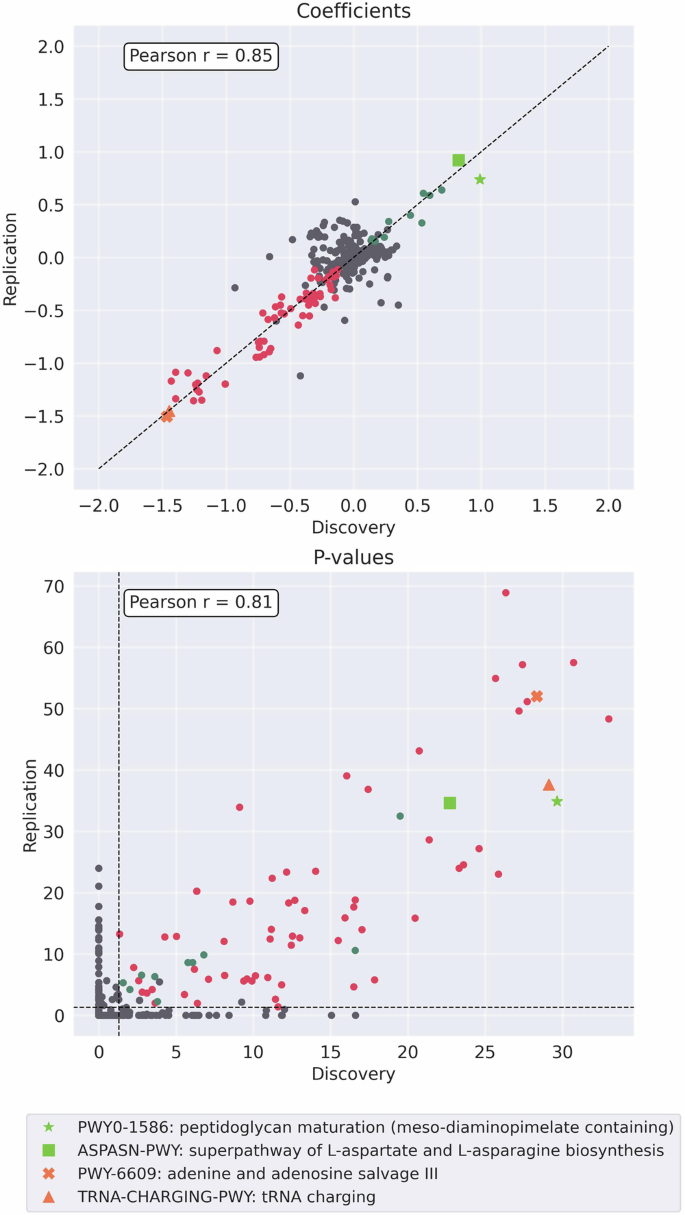
Figure 4 displays the association coefficients and p-values of bacterial pathways, from the discovery and the replication cohorts, illustrating a consistent pattern in the distribution of significantly correlated pathways, both negative and positive. Importantly, the pathways that exhibited the strongest correlations—identified by the highest association coefficients from the significantly associated bacterial pathways —were consistent across both cohorts (Fig. 4). The top two bacterial pathways with the strongest positive correlations with BMI in both cohorts were PWY0-1586: peptidoglycan maturation (meso-diaminopimelate containing) and ASPASN-PWY: superpathway of L-aspartate and L-asparagine biosynthesis. These pathways, also identified as “key” pathways in our main analysis, demonstrated multiple significant correlations with metabolic health measures in the discovery cohort. The top two pathways that exhibited the strongest negative correlations with BMI in both cohorts were PWY-6609: adenine and adenosine salvage III, and TRNA-CHARGING-PWY: tRNA charging, both also selected as “key” bacterial pathways in the discovery cohort analysis, as well as the sensitivity analysis adjusting for nutritional summaries. The similar patterns of correlations coefficients and p-values were also found for bacterial gene families, as depicted in Fig. S13.

Coefficients (top) and P-values (−log scale) (bottom) of the associations between bacterial pathways and BMI, in the discovery vs. the replication cohort. Associations were performed using two-sided linear regression adjusted for age and sex. Multiple comparisons were corrected using the Bonferroni method, and associations with Bonferroni-corrected p-value < 0.05 were considered significant. Colored dots present bacterial pathways with significant associations in both cohorts, and with either a negative (red) or positive (green) correlation coefficient in both cohorts. Light green (Square and Asterix) mark the top two bacterial pathways with positive coefficients in both cohorts, Orange (Triangle and X) mark the top two bacterial pathways with negative coefficients in both cohorts.
link


