


Data sources
The data for this study were obtained from eight cycles of the National Health and Nutrition Examination Survey (NHANES), covering the years 1999–2006 and 2011–2018. The NHANES database regularly gathers nationally representative health-related data from the non-institutionalized U.S. population using a stratified, multistage probability sampling design10. The survey received approval from the NCHS Research Ethics Review Committee, ensuring that informed consent was obtained from all participants. Additional details regarding the study samples can be found on the NHANES website(https://www.cdc.gov/nchs/nhanes/).
Study design and population
The National Center for Health Statistics (NCHS) Research Ethics Review Board approved all NHANES study protocols for the periods 1999–2006 (Protocols #98 − 12 and #2005-06) and 2011–2018 (Protocol #2011-17). Written informed consent was obtained from participants during each survey cycle. Consequently, no additional ethical approval or informed consent was required. All analyses were conducted in compliance with NHANES guidelines and regulations.
Strict exclusion criteria were applied to ensure the scientific rigor and consistency of the study sample. This cross-sectional study utilized data from the NHANES, spanning two periods: 1999–2006 and 2011–2018. The analysis focused on adults aged 20 years and older.The exclusion criteria were as follows: 34,181 participants under 20 years old were excluded, 42,537 participants without information on MetS and cancer were removed, 596 participants missing data required for FMI calculation were excluded, and 2,517 participants with incomplete covariate data were also excluded. Ultimately, out of the initial 80,630 participants, only 799 met the eligibility criteria and were included in the final analysis (Fig. 1).

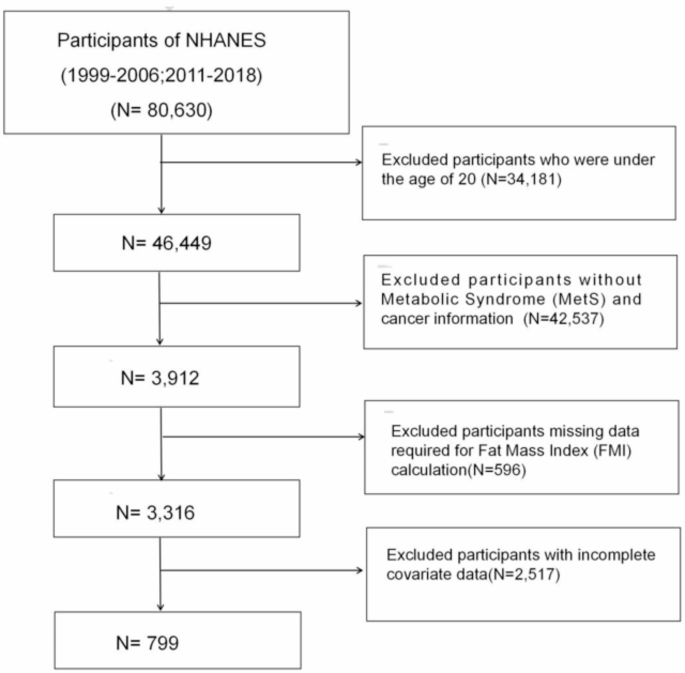
Flowchart for Study Participant Selection: NHANES 1999–2006 & 2011–2018.
Measurement of fat mass index
FMI was calculated based on body fat mass, which was measured using dual-energy X-ray absorptiometry (DXA), a well-established and reliable method for body composition analysis. FMI was determined by dividing participants’ total fat mass (in kilograms) by the square of their height (in meters), according to the following formula:
FMI = Fat Mass (kg) / Height (m2)11.
To address missing DXA data, we adhered to the Centers for Disease Control and Prevention (CDC) guidelines, which recommend applying multiple imputation techniques. Specifically, five imputed datasets were generated to handle missing values within the NHANES dataset. These imputed datasets were then pooled, and subsequent analyses were performed using the R statistical software. For the purpose of the analysis, participants’ total fat mass was categorized into tertiles (T1-T3) to assess variations in FMI across different levels of fat mass.
Ascertainment of cancer
NHANES includes a medical conditions section that gathers self-reported health information. By focusing on individuals who have been diagnosed with cancer, we aim to understand the long-term effects of cancer and its treatment on metabolic health, which is crucial for developing tailored interventions and improving the quality of life for cancer survivors.
Individuals who had a history of cancer or malignancy were identified based on their affirmative responses to the inquiry, ‘Have you ever been informed by a medical doctor or health care provider that you have had cancer or any form of malignancy?’Subsequently, those who acknowledged a cancer diagnosis were asked to specify the exact type of cancer they were diagnosed with.
Ascertainment of MetS
MetS is defined according to the diagnostic criteria established by the National Cholesterol Education Program Adult Treatment Panel III (NCEP ATP III)12. According to the International Diabetes Federation (IDF), metabolic syndrome is diagnosed if at least three of the following conditions are met: (1) Waist circumference of at least 102 cm in men or 88 cm in women; (2) Triglyceride levels at or above 1.69 mmol/L (150 mg/dL); (3) Low HDL cholesterol, defined as levels below 1.03 mmol/L in men or below 1.29 mmol/L in women; (4) Hypertension, defined as a systolic blood pressure of 130 mmHg or higher, diastolic blood pressure of 85 mmHg or higher, current use of antihypertensive medication, or a diagnosis of hypertension by a physician; (5) Hyperglycemia, defined by fasting blood glucose levels of 100 mg/dL or higher, current use of glucose-lowering therapy, or a diagnosis of diabetes.
Covariates
In our study, covariates included a variety of factors: Age (years, continuous), gender (female/male), race/ethnicity (Mexican American, Non-Hispanic Black, Non-Hispanic White, Others), educational level (below high school, high school or above), marital status (married/cohabitant, widowed, divorced/separated, never married), Poverty Income Ratio (PIR, continuous).Alcohol consumption was assessed using self-reported data from the previous year, collected through the Alcohol Use Questionnaire (ALQ101), which inquired whether participants had consumed at least 12 alcoholic drinks in the past year. Based on this data, participants were classified into five groups (never, mild, moderate, heavyand former)13.Additional covariates included smoking status (never, former, current), and the presence of various disease conditions, such as diabetes, hypertension, hyperlipidemia, stroke, coronary heart disease (CHD), chronic kidney disease (CKD). The diabetes category was further divided into diabetes mellitus (DM), impaired fasting glycemia (IFG), and impaired glucose tolerance (IGT). Hypertension, hyperlipidemia, stroke, CHD, and CKD were diagnosed based on index measurements, medication usage, and self-report. BMI was calculated as weight (kg) divided by the square of height (m2). It was categorized as < 25 kg/m2,25–29.9 kg/m2, and ≥ 30 kg/m2 based on their BMI.Physical activity (PA) is measured using Metabolic Equivalent of Task (MET) minutes on a weekly basis. It is divided into three levels: low (less than 600 min per week), moderate (600 to 8,000 min per week), and high (8,000 min or more per week). The MET values, which are calculated from the responses to the Physical Activity Questionnaire (PAQ), serve as the basis for assigning PA into these respective categories14.The NHANES laboratory data from 1999 to 2006 and 2011–2018 included both males and females and encompassed measurements for triglycerides (TG, mg/dL, continuous), high-density lipoprotein (HDL, mg/dL, continuous), low-density lipoprotein cholesterol (LDL, mg/dL, continuous), fasting glucose (mg/dL, continuous), total cholesterol (TC, mg/dL, continuous), and other relevant biomarkers.
Statistical analysis
In this study, the sample weights, stratifications, and clustering methods utilized in the NHANES study were applied to all statistical analyses to account for the complex, multistage sampling design employed to select a representative sample of the noninstitutionalized civilian U.S. population15. Our study sample comprised eight cycles of continuous NHANES data, spanning from 1999 to 2006 and from 2011 to 2018. To account for the U.S. population, sampling weights were adjusted, with distinct reference populations assigned to each of the two periods. For the 1999–2002 cycles, the 4-year sampling weights (wtsaf4 year) were used, whereas the 2-year sampling weights (wtsaf2 year) were applied to the cycles from 2003 to 2006 and 2011–2018. Furthermore, the NHANES stratification variable (SDMVSTRA) and the primary sampling unit variable (SDMVPSU) were included according to the survey design to ensure precise variance estimation. The survey design R package was used to process the dataset’s sampling weights, which were then integrated into the survey design analyses.
Participants were categorized into groups with and without MetS. Differences between the groups were assessed using Chi-square (χ2) tests for categorical variables and ANOVA for continuous variables. Continuous variables are reported as weighted means ± standard errors (SEs), and categorical variables are presented as weighted proportions. Descriptive statistics for the entire study population were computed, and the FMI was categorized into tertiles. The association between FMI and MetS was evaluated using multivariate logistic regression, with results presented as odds ratios (ORs) accompanied by 95% confidence intervals (CIs).Model 1 did not include any variable adjustments, while Model 2 adjusted only for age, ethnicity, and gender. Model 3 further adjusted for marital status, BMI, education, alcohol consumption, smoking status, PIR, MET, total energy, stroke, CHD, CKD, and cancer types.Then, an analysis using a weighted restricted cubic spline (RCS) with four knots was conducted to explore the nonlinear relationships between the risk of MetS and FMI among cancer patients. Additionally, subgroup analyses and interaction tests were conducted to further explore the association between FMI and MetS.The results were visually represented with forest plots generated using the “forestplot” R package, which effectively highlight subgroup-specific effects.All statistical analyses were performed using R software (version 4.4.1), with a two-sided p < 0.05 deemed statistically significant.
link